After The Close, 21 Jul 2010
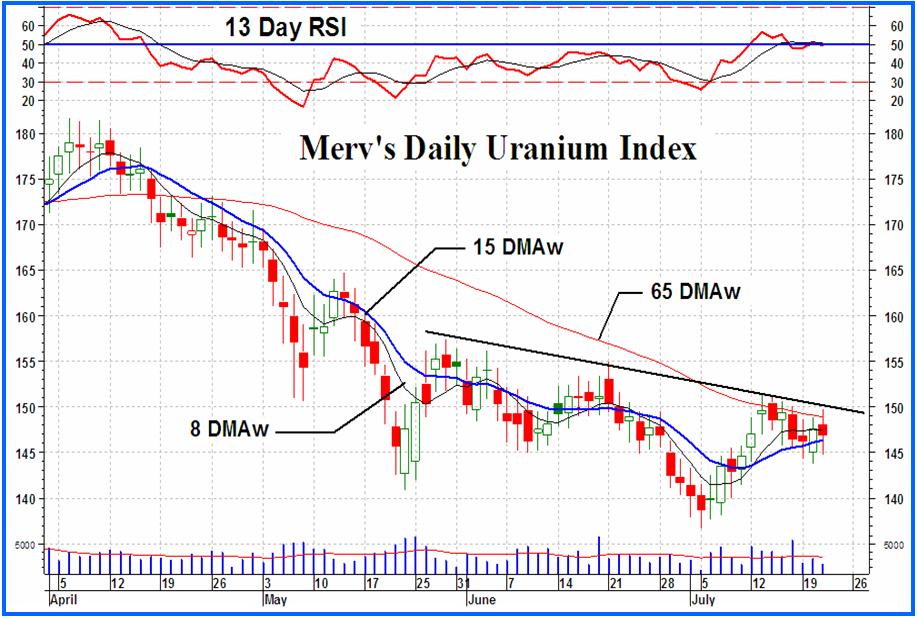
Merv’s Daily Uranium Index
Market Data
Open: 148.09
High: 149.70
Low: 144.74
Close: 146.90
Volume: 2363
Note that the volume is an average volume of round lot sales for the 50 component stocks. For total volume, multiply by 5000.
Still waiting for the down trend line and the intermediate term moving average lines to be breached. So close and yet so far away. The day started on the up side but the Index just didn’t have the energy to break through. Maybe tomorrow.
The Merv’s Daily Uranium Index closed lower by 0.58 points or 0.39%. The biggies in the Index basically pulled the Index down. The average price of a component stock gained 0.54%. There were 19 winners, 23 losers and 8 stocks just hanging around. Cameco lost 1.5%, Extract gained 1.7%, Fronteer lost 0.8%, Paladin lost 3.9% and Uranium One lost 0.4%. The best winner of the day was a tie between Uranerz Energy and Quest Rare Minerals each with a gain of 13.4%. The worst loser of the day was Benton with a loss of 11.6%. Market Vectors Nuclear Energy ETF lost 2.1%.
On the intermediate term I’m still waiting for the Index to cross above its moving average line. For now the Daily Index remains below its negative sloping moving average line. The momentum indicator remains in its negative zone but above its positive trigger line. The Volume indicator is mostly in a lateral trend but is very slightly below its negative trigger line. All in all the intermediate term rating must remain BEARISH. The short term moving average line remains below the intermediate term line for confirmation of the rating.
On the short term things are changing almost daily. The Index remains above its positive moving average line but the momentum indicator has once more dropped below its neutral line into the negative zone. It has also crossed below its trigger line and the trigger has turned downward. From these I have to lower the rating slightly to a + NEUTRAL rating, one level below a full bull. The short term moving average line remains above the short term line and is not yet giving us a negative confirmation.
As for the immediate direction of least resistance, I will stick with the up side for another day.

No comments:
Post a Comment