for week ending 21 May 2010
Merv’s Daily Uranium Index
Market Data for Friday 21 May 2010
Open: 142.70
Hugh: 150.27
Low: 140.76
Close: 147.61
Volume: 5693
Note that the volume is an average volume of round lot sales for the 50 component stocks. For total volume, multiply by 5000.
Note that additional charts of the Daily and Weekly Indices were posted earlier and should be viewed during this commentary.
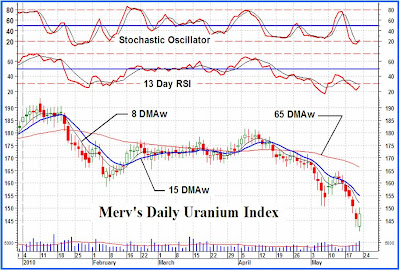
It’s been one hell of a week, in fact a hell of a month and a half. Is it going to last much longer is the question. I don’t think so. For one, if I really tried I can draw my three bullish accelerating FAN trend lines (not shown on the charts), the breaking of this third trend line would confirm a reversal in progress. That would only take another good upside day, or two at the most as long as they are consecutive. As mentioned later, the Stochastic Oscillator has entered its oversold zone and now seems to be in a reversing mode, and closed on Friday above the oversold line. So, there are some signs that we are close to an end of this misery. Of course even if this misery ends there is no guarantee that after a bounce another misery is not around the corner. We just have to take it as it comes and be on the right side of the trend.
The Merv’s Daily Uranium Index closed up on Friday by 1.96 points or 1.34%. That does not really tell us the whole story. The Index moved lower initially but reversed during the day to close on the up side. From the opening to the close was a 5 point move, or 3.4%. There were 28 daily winners, 12 losers and 10 that still were unsure of themselves. Cameco gained 1.0%, Extract gained 0.6%, Fronteer gained 3.0%, Paladin gained 3.0% and Uranium One gained 1.8%. The best daily winner was Wealth Minerals with a gain of 33.3% while the loser of the day was Khan Resources with a loss of 53.9% (fun and games working in foreign lands. Khan must really be seeing red). Market Vectors Nuclear Energy ETF gained 1.5%.
For the week as a whole the Merv’s Weekly Uranium Index lost 476.04 points or 9.85%. There were only 5 weekly winners, 44 losers and one stock unsure of itself. Cameco lost 1.8%, Extract lost 9.9%, Fronteer lost 6.6%, Paladin lost 9.8% and Uranium One lost 7.9%. The best weekly winner was Wealth Minerals with a weekly gain of 15.5% while the weekly loser was Khan Resources with a weekly loss of 56.6%. Market Vectors Nuclear Energy ETF lost 7.8% on the week.
I had just finished putting together my weekly gold service and the disaster that uranium has shown this week is nothing compared to the disaster that the gold and silver stocks took. There were only 3 winners out of my universe of 160 stocks during the week. THAT’S a disaster. However, the ratings for the various gold Indices were still on the bullish side so one week disaster was livable.
For uranium stocks the ratings have a different feel. On the long term both the Weekly and Daily Indices closed below their respective negative sloping moving average lines. The same situation holds for the momentum indicators, both are in their negative zones below negative trigger lines. As for the volume indicator, it’s not all that bad as it has not yet moved below it previous lows of last October. However, the indicator is moving lower and is below its negative trigger line. All in all the long term rating for both Indices is BEARISH.
We have the same all negative situation in the intermediate term indicators. The Daily Index remains below its negative sloping moving average line. The momentum indicator remains in the negative zone below its negative trigger line. The volume indicator continues to move lower below its negative trigger line. Nothing much positive here. The intermediate term rating remains BEARISH. The short term moving average line continues to confirm this rating by remaining below the intermediate term line.
We seem to be getting the very early inklings of improvement in the short term indicators although their message is still unchanged. The Index remains below its negative moving average line. The momentum indicator remains in its negative territory below its negative trigger line. It had been in its oversold zone and has now crossed above the oversold line. More importantly, the momentum indicator has given us a positive divergence suggesting a reversal may be just about to occur. We’ll take any positive we can get. As for the daily volume action, it has been moving higher during the weeks down days but on Friday, an up day, the daily volume was at its highest daily level in over two months. Another small positive to grab on to. Unfortunately, as of Friday the indicators still had us at a BEARISH rating. This is confirmed by the very short term moving average line remaining below the short term line.
As for the immediate direction of least resistance, I’m going out on a limb and taking the up side for the coming couple of trading days. With that good volume day along with the turning of the Stochastic Oscillator we are in position for some upside action.

No comments:
Post a Comment